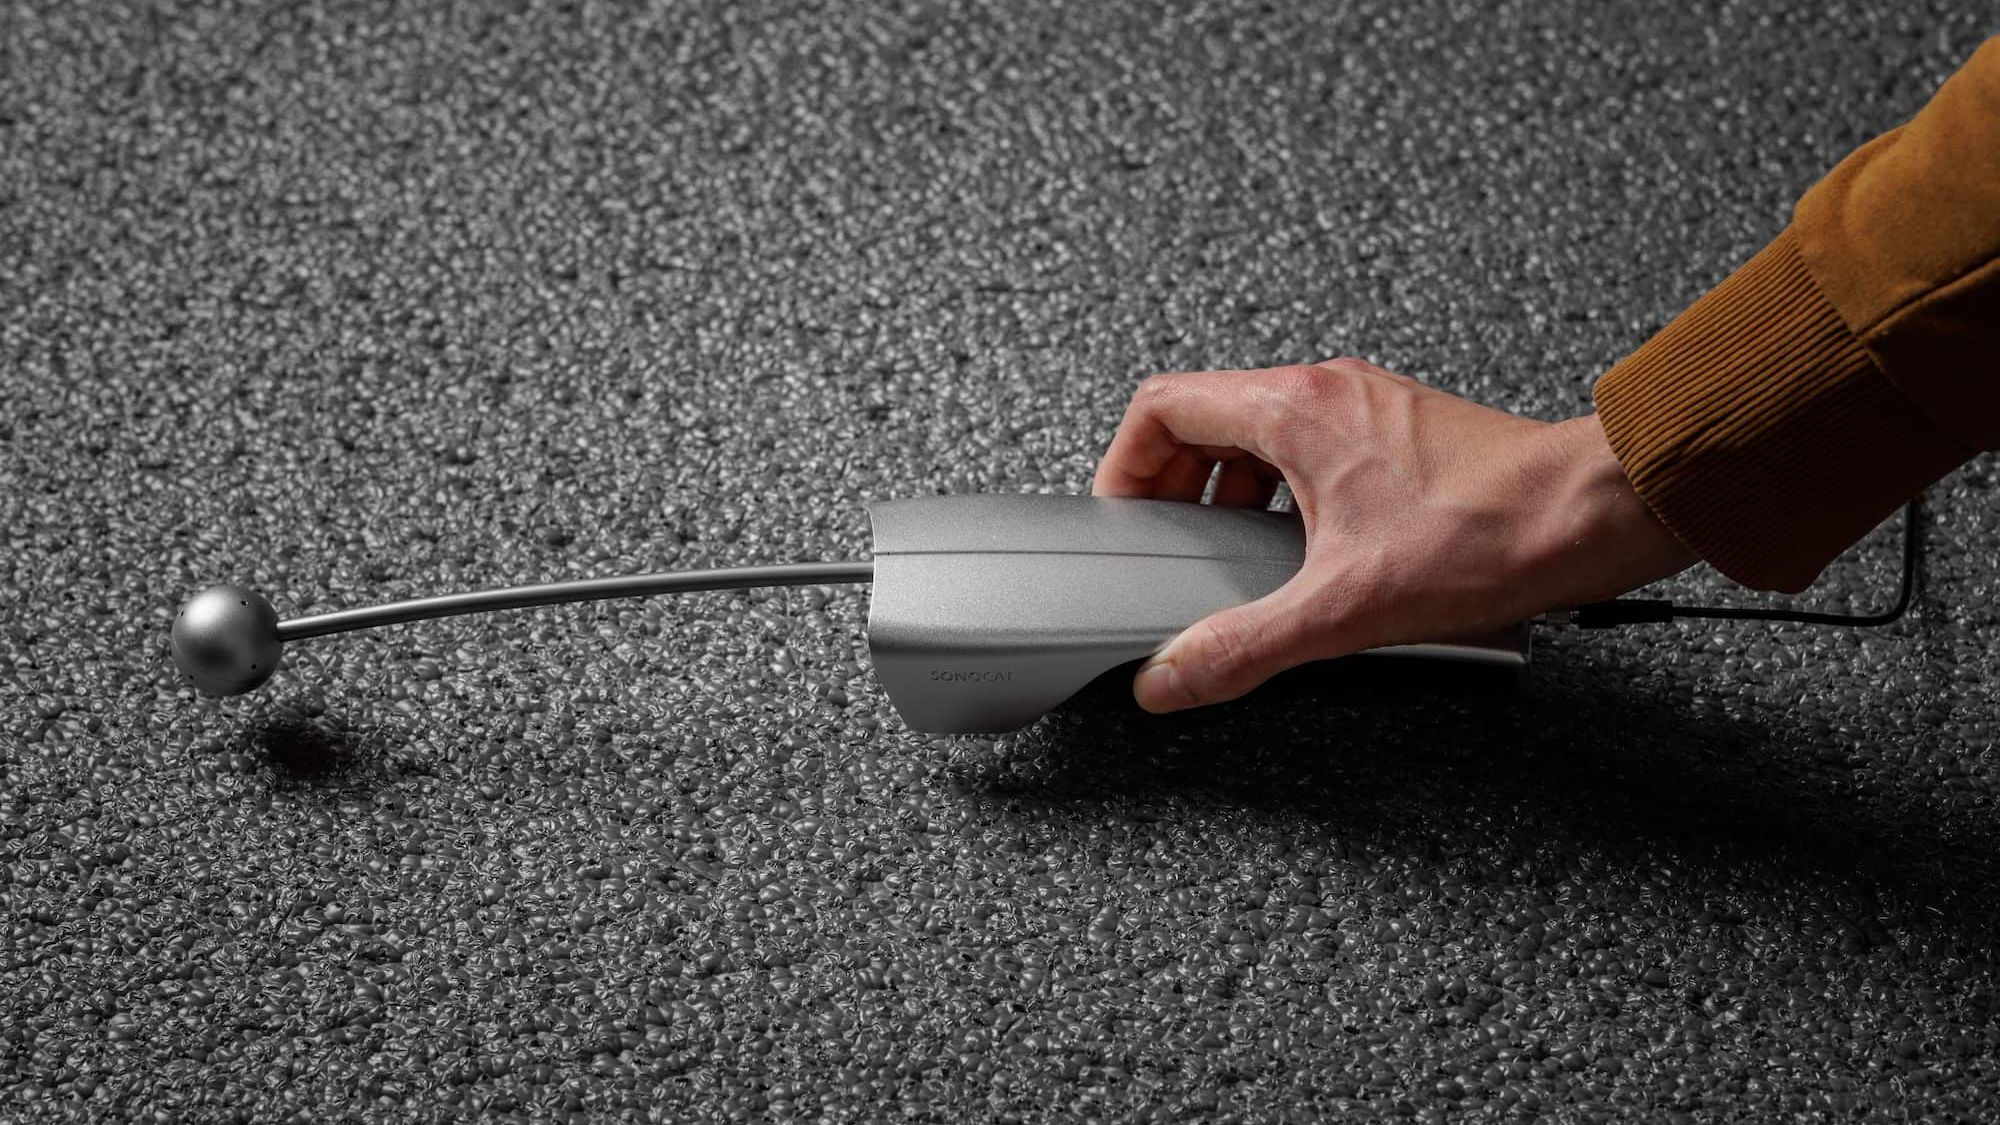

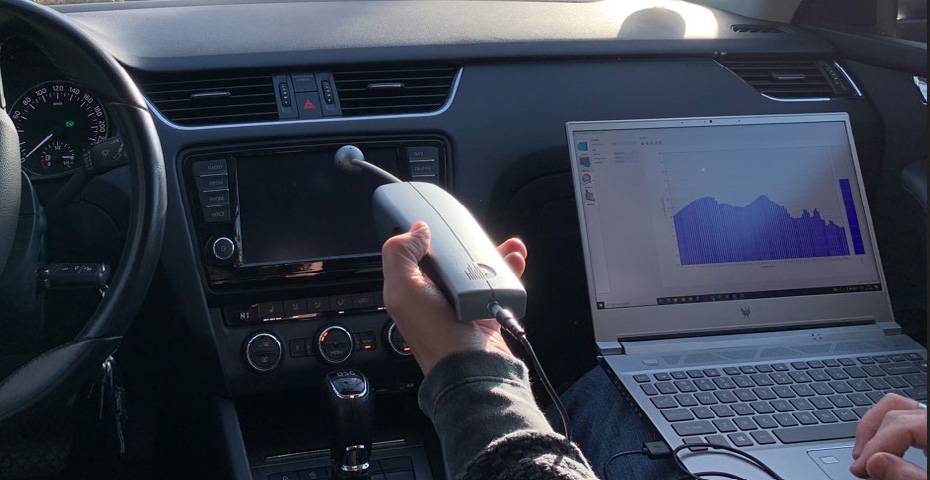
An evaluation of noise leakage in a vehicle cabin was conducted. Measurements were done with the Sonocat inside a moving car at an NVH test track. Figure 1 depicts the measuring rig (Sonocat device and software). Initially, discrete point measurements were executed to obtain preliminary acoustic data within the vehicle cabin and to familiarize with the acoustic environment. Subsequently, comprehensive scans were conducted across targeted interior regions suspected to contribute to noise leakage. Total time was approximately 30 minutes. Post-processing of the acquired data enabled the identification of key noise-emitting surfaces within the cabin.
measurements and results.
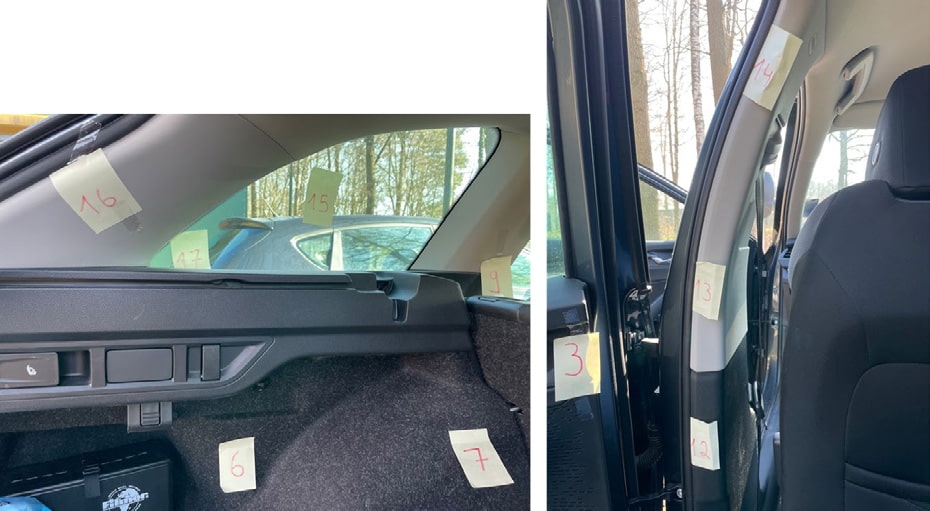
Figure 2 illustrates several labelled regions where acoustic measurements were conducted. These labels correspond to the scan identification numbers and descriptions of the respective scanned areas, which are associated with the measurement data files presented in Figure 3.
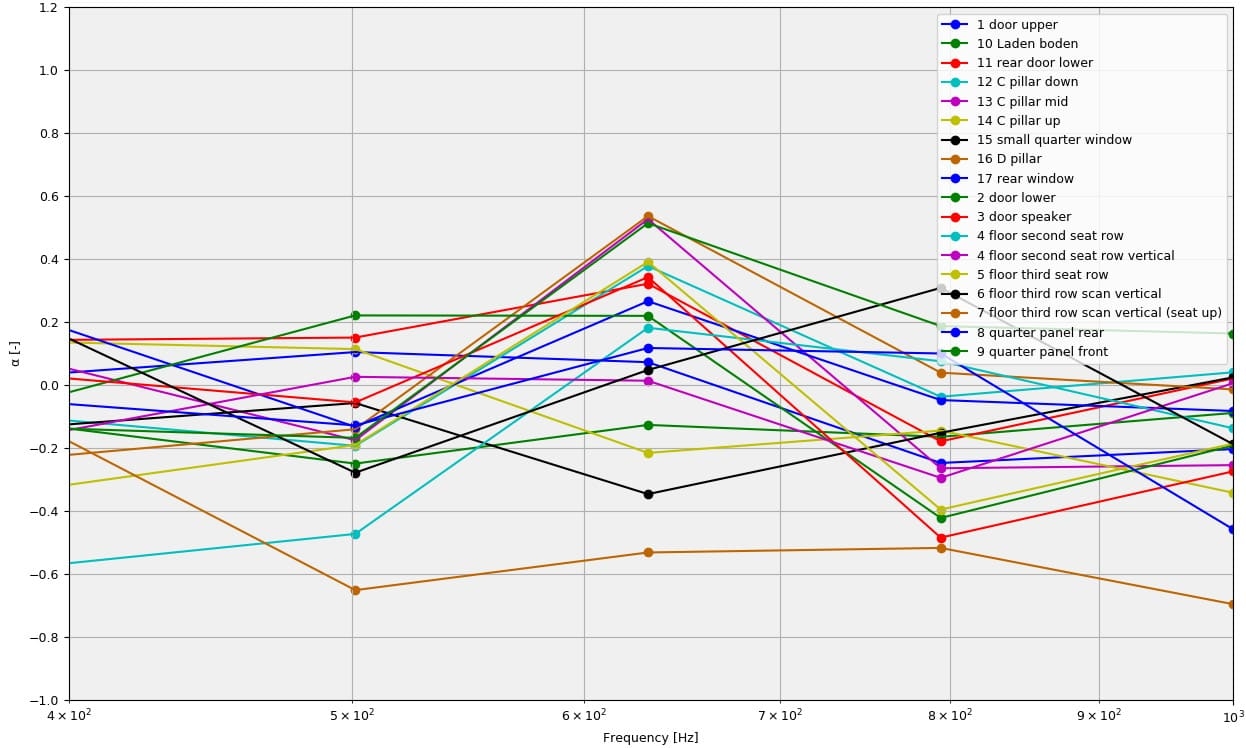
The active acoustic power (difference between incident and reflected acoustic power through the scanned area) and the absorption/emission coefficient (the ratio of active power to incident/emitted power) were quantified. For visualization purposes, the emission coefficient is represented as a negative absorption coefficient, allowing both parameters to be displayed together, as shown in Figure 4. Consequently, a negative active power indicates sound emission from the scanned area, with larger negative values of the emission coefficient signifying more efficient sound emission. Thus, the most significant noise entering the cabin originates from areas where the emission coefficients exhibit the highest negative values.
The measured absorption/emission coefficients are shown in Figure 4 in 1/3-octave bands for the frequency range of interest (between 400 Hz and 1 kHz). Clearly, one observes large negative values of the emission coefficient for area 7. Other surfaces show either less emission or absorption of the incident sound.
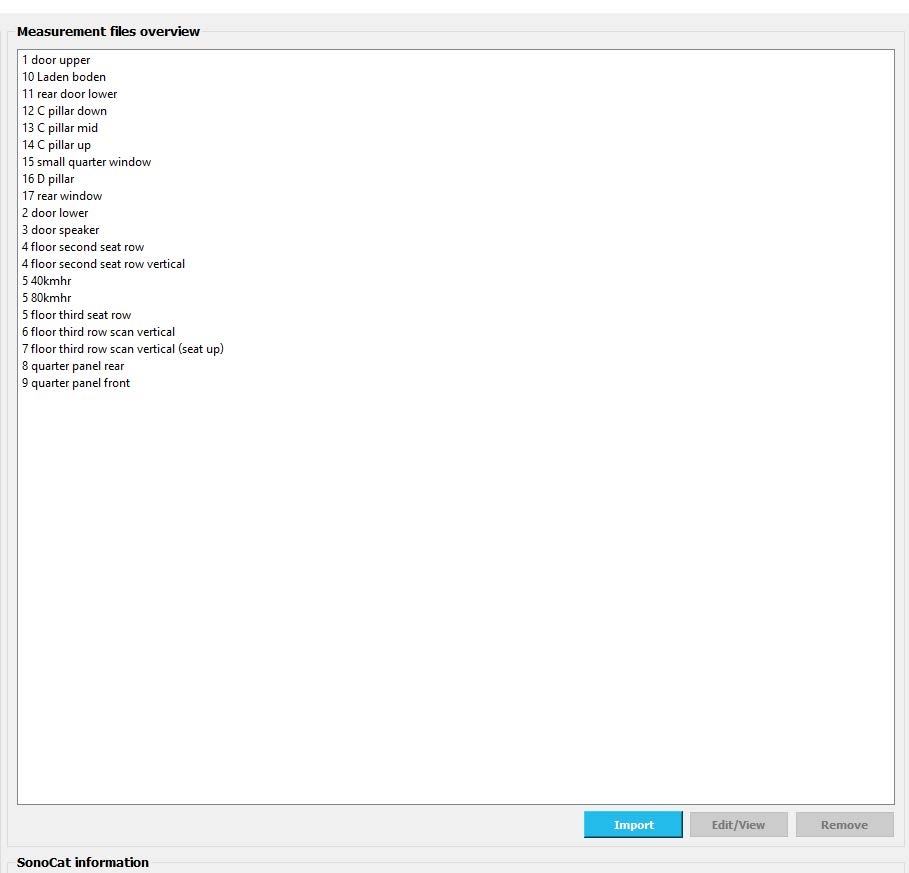
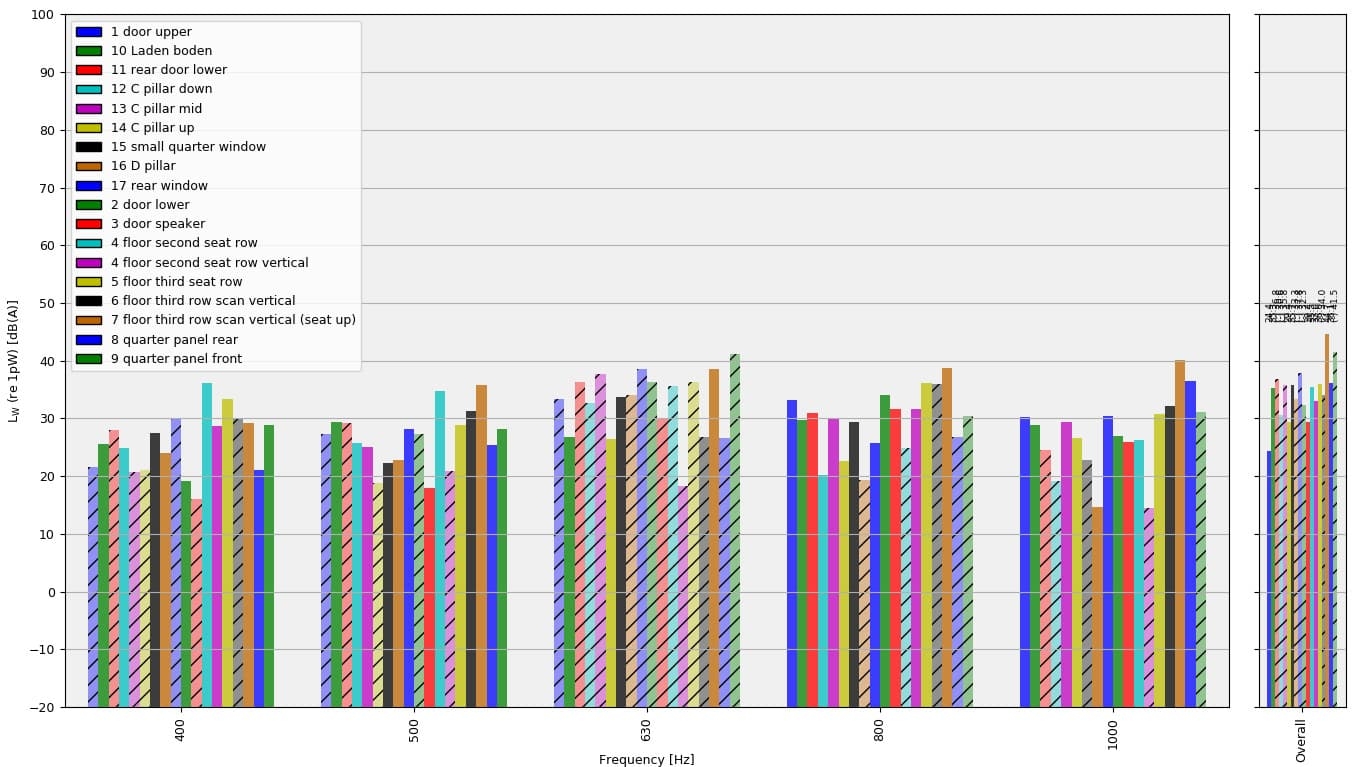
Figure 5 shows the active sound power of all measured areas. In this graph, the solid bars indicate positive sound power and the hashed are negative. It can be noticed that between the 500 Hz and 1 kHz 1/3 octave bands area 7 has the largest emitted power. Also other areas such as 4, 10, 14 and 15 show emitted sound power. Most surfaces seem to absorb sound as the active powers are negative (hashed bars).
conclusion.
The Sonocat can be used to localize noise leakage inside a car cabin which has a very complex sound field. The results of this test show that area 7 is the dominant source of noise for the assessed frequency range, this was in line with the observations from the NVH engineers who then were able to find a misalignment at the sound blocking carpet.
“The Sonocat even maps noise leakage inside a car cabin while driving, delivering reliable results in complex sound fields.”